Selected research

Three projects: an open question, a principled method, and the experiment that tests it.

Current methods · NeurIPS 2025 and NeurIPS 2026 (oral)

Measuring what neural networks encode

Which inputs and features contribute to the information that a neural population represents?

Two handwritten digits, the Fisher information of a model population of visual neurons, which shows the grid of receptive fields, and the decomposition of mutual information, which traces the contours of each digit
Information about two digits x encoded by simulated visual neurons. Fisher information 𝒥(x) mostly reflects receptive fields; our decomposition Ilocal(x) traces each digit's contours. NeurIPS 2025.
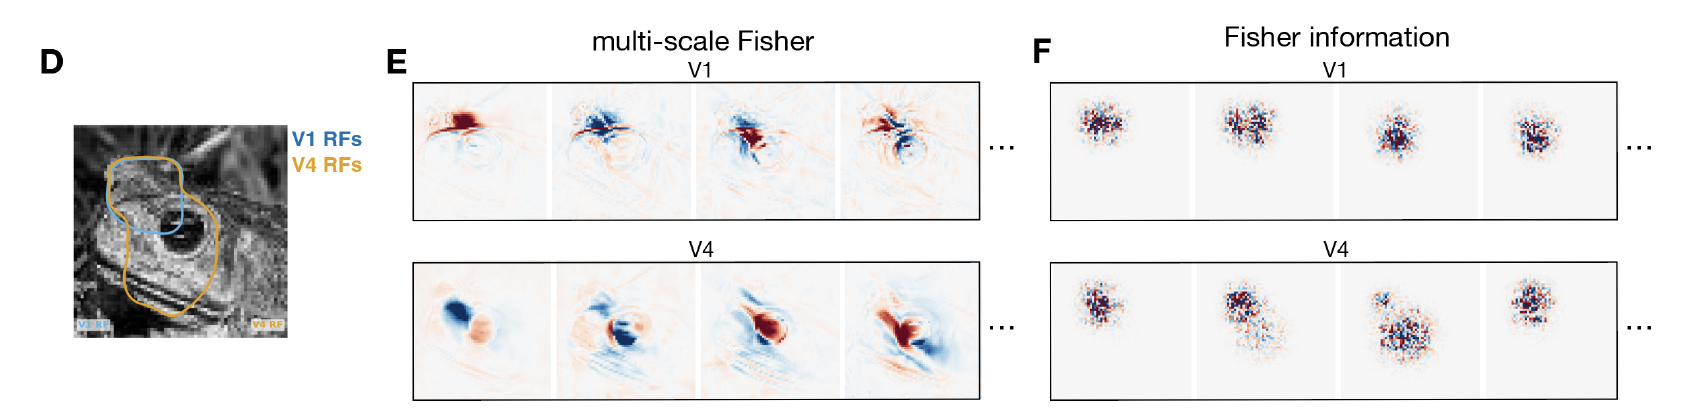
Receptive fields of V1 and V4 recordings on a natural image, the leading stimulus directions of the multi-scale geometry, which are structured and differ between areas, and those of Fisher information, which look like noise
Leading stimulus directions for macaque V1 and V4 (D, receptive fields): structured and area-specific for the multi-scale geometry (E), noise-like for Fisher information (F). NeurIPS 2026.

Approach

Mutual information says how much a population encodes, not what. We derived, from explicit axioms, a decomposition of it across stimuli and features, then a multi-scale information geometry exactly related to it. Both are estimated with diffusion models, so they scale to natural images.

Result

Existing decompositions violate at least one axiom; ours satisfies them all. On macaque V1 and V4 recordings, the leading directions of the geometry were interpretable, differed between areas and agreed across encoding models, whereas those of Fisher information depended more on the model than on the data.

Why it matters for AI

The methods apply to any encoder, biological or artificial, and stay interpretable for high-performing deep networks.

My contribution

Co-first author of the NeurIPS 2025 paper, co-author of the NeurIPS 2026 oral, and developer of multigeom.

Established contribution · Neuron 2018

Telling apart mechanisms behind near-optimal behaviour

Can behaviour that matches Bayesian predictions arise from a different computation?

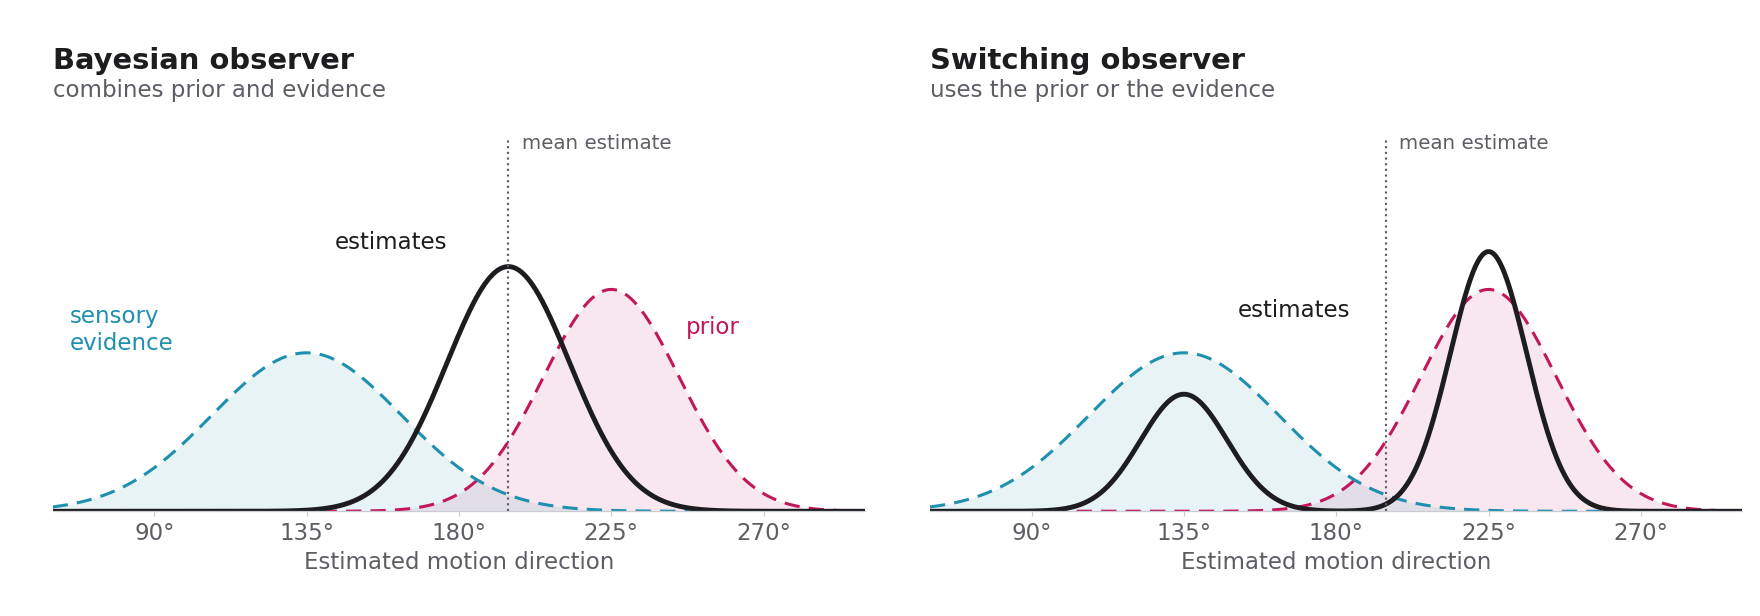
Schematic: a Bayesian observer predicts a single mode of estimates between the prior and the sensory evidence; a switching observer predicts two modes, one at the prior and one at the evidence, with the same mean estimate
Schematic. Both observers can predict the same mean estimate; only the full distribution tells them apart. Human estimates were bimodal, as the switching observer predicts.

Approach

Perceptual estimates often match, on average, a Bayesian observer that combines prior and evidence. In motion-direction and orientation tasks, we varied the strength of the evidence and of the prior, and compared full estimate distributions with Bayesian observers and alternatives.

Result

Means and variability matched a basic Bayesian observer, yet estimates were bimodal, near the prior and near the evidence. An observer that switches between them, rather than combining them, explained the data better than the basic and several other Bayesian observers.

Why it matters for AI

Matching average performance does not identify the computation; full response distributions under controlled conditions can.

My contribution

First author: designed the study with Justin Gardner, ran the experiments, analysed the data and co-wrote the paper.

Subsequent research

  • Chetverikov & JeheeNature Communications, 2023
    Test the switching observer as an alternative account of bimodal motion-direction reports.
  • Bévalot & MeynielCommunications Psychology, 2024
    Cite it when noting that quantifying how Bayesian a computation is requires more model comparisons.

Also cited by de Lange, Heilbron & Kok (Trends in Cognitive Sciences, 2018), Darlington, Beck & Lisberger (Nature Neuroscience, 2018), Sohn & Jazayeri (PNAS, 2021) and Kovács & Lengyel (Current Opinion in Neurobiology, 2026).

Research reliability · Nature Communications (accepted)

Evaluating spike sorting against ground truth

When does a data-processing pipeline change what we conclude about a neural system?

Ring-shaped neural manifold of the ground-truth population responding to 360 stimulus directions, and distorted, broken or collapsed manifolds of the populations isolated by six spike sorters and by threshold crossing
Manifolds evoked by 360 stimulus directions in the ground-truth population and in the units isolated by six sorters and by threshold crossing: sorting distorts the population geometry.

Approach

In real recordings the true spikes are unknown, so sorting errors cannot be measured. We simulated dense recordings from a detailed model of a rat cortical column (30,190 neurons) in which every spike is known, validated them against in vivo data, and evaluated modern sorters, including their effect on stimulus discrimination.

Result

Sorters isolated about 10% of the neurons within 50 µm of the probe. This undersampling alone did not impair stimulus discrimination, but biases related to firing rate, spike extent, synaptic type and layer nearly halved it.

Why it matters for AI

Pipeline errors can be systematic rather than random, and change the conclusion; evaluations need ground truth that shows which cases fail.

My contribution

First and corresponding author. I wrote spikebias, which measures these biases, and spikecurate, which selects well-sorted units.

Subsequent research

  • Garcia et al.eLife, 2026
    Identify full-network simulations like ours as a source of complete ground truth for spike-sorting benchmarks, noting their computational cost.
  • Buccino et al.eLife, 2026
    Discuss it among simulation-based benchmarks of spike sorters.

Also cited by Siegle & Steinmetz (Nature Reviews Neuroscience, 2026) and Giraud et al. (eLife, 2025).

Earlier work

Learning in the basal ganglia

Dorsal putamen activity at the start of a session predicted whether monkeys would have a good or a bad learning day. PLoS ONE, 2013 · first author.

Self-organising network structure

Adaptive rewiring of directed networks produces convergent–divergent units, hubs that pool inputs and broadcast outputs. Communications in Nonlinear Science and Numerical Simulation, 2022.